/* ============================================================
   EMI Soil Scanning — Electrical Conductivity at three depths.
   The foundation every other layer sits on.
   ============================================================ */

(function () {

  window.EMIPage = function EMIPage({ setRoute }) {

    return (
      <>
        <header className="page-head hero-bg" data-img-file="assets/emi-hero-cover-90ec.png" style={{ '--page-head-bg': "url('assets/emi-hero-cover-90ec.png')" }}>
          <div className="container-wide">
            <div className="crumbs">
              <a href="#" onClick={(e) => {e.preventDefault();setRoute('home');}}>Home</a>
              <span>/</span>
              <a href="#" onClick={(e) => {e.preventDefault();setRoute('revscout-s');}}>Tools</a>
              <span>/</span>
              <span>EMI Soil Scanning</span>
            </div>
            <h1>Map the soil <em>beneath every tree.</em></h1>
            <p className="lede">EMI scanning fills the gap your 50&thinsp;×&thinsp;50&nbsp;m chemical grid leaves behind — mapping soil Electrical Conductivity at three depths (25, 50 and 90&nbsp;cm) at a practical 5&thinsp;×&thinsp;5&nbsp;m resolution. The foundation every other layer sits on, and the first layer your RevToolbox loads.</p>
            <div style={{ display: 'flex', gap: 10, flexWrap: 'wrap', marginTop: 'var(--space-3)' }}>
              <a className="btn btn-primary" href="#" onClick={(e) => {e.preventDefault();setRoute('contact');}}>Book a scan →</a>
              <a className="btn btn-ghost" href="#" onClick={(e) => {e.preventDefault();setRoute('pricing');}}>See pricing →</a>
            </div>
          </div>
        </header>

        {/* EMI ============================================== */}
        <section id="emi" className="section">
          <div className="container-wide">
            <div className="tools-row">
              <div className="tools-text">
                <div className="section-eyebrow">EMI · Data Source</div>
                <h2 className="section-title">EMI Soil Scanning</h2>
                <p className="section-lede">Where standard chemical grids only sample every 50×50 m, EMI scanning fills in the gaps — mapping soil Electrical Conductivity at three depths (25, 50 and 90 cm) at a practical 5×5 m resolution. The foundation every other layer sits on, and the first layer your RevToolbox loads.</p>
                <ul className="tools-points">
                  <li>EC at 25, 50 and 90 cm — root, sub-root, drainage zones</li>
                  <li>5 × 5 m practical resolution</li>
                  <li>Targeted soil sampling instead of grid</li>
                  <li>Drainage and irrigation block design</li>
                  <li>Soil moisture probe placement recommendations</li>
                </ul>
                <a className="btn btn-ghost" href="#" onClick={(e) => {e.preventDefault();setRoute('pricing');}}>See pricing →</a>
              </div>
              <div className="tools-visuals">
                <div className="tools-viz-label" style={{ marginBottom: 8 }}>EC at three depths · 5 × 5 m resolution</div>
                <div style={{ display: 'grid', gridTemplateColumns: '1fr 1fr 1fr', gap: 10 }}>
                  {[
                  { depth: '25 cm', sub: 'Root zone', file: 'assets/emi-block-ec-25cm.png' },
                  { depth: '50 cm', sub: 'Sub-root', file: 'assets/emi-depth-50cm.png' },
                  { depth: '90 cm', sub: 'Drainage', file: 'assets/emi-depth-90cm.png' }].
                  map((d, i) =>
                  <figure key={i} style={{ margin: 0, display: 'flex', flexDirection: 'column', gap: 6 }}>
                      <div
                      role="img"
                      aria-label={`EMI EC scan at ${d.depth} depth — ${d.sub}`}
                      data-img-file={d.file}
                      style={{
                        aspectRatio: '4 / 3',
                        backgroundImage: `url('${d.file}')`,
                        backgroundSize: 'cover',
                        backgroundPosition: 'center',
                        borderRadius: 6,
                        border: '1px solid var(--line)'
                      }} />
                      <figcaption style={{
                      fontFamily: 'JetBrains Mono, monospace', fontSize: 10, letterSpacing: '0.08em',
                      color: 'var(--muted)', display: 'flex', justifyContent: 'space-between',
                      textTransform: 'uppercase'
                    }}>
                        <strong style={{ color: 'var(--charcoal)', fontWeight: 600 }}>{d.depth}</strong>
                        <span>{d.sub}</span>
                      </figcaption>
                    </figure>
                  )}
                </div>
                <div className="tools-viz-sub">
                  <div className="tools-viz-label">EMI scanner sled · towed through a block</div>
                  <div
                    role="img"
                    aria-label="EMI scanner sled towed through a vineyard block"
                    data-img-file="assets/emi-scan-photo.jpg"
                    style={{
                      width: '100%', aspectRatio: '16 / 10',
                      backgroundImage: "url('assets/emi-scan-photo.jpg')",
                      backgroundSize: 'cover',
                      backgroundPosition: 'center',
                      borderRadius: 8,
                      border: '1px solid var(--line)'
                    }} />
                </div>
              </div>
            </div>

            {/* ============== EMI · EC + NDVI featured compare ============== */}
            <div className="emi-sub" id="emi-pair">
              <div className="emi-sub-head">
                <div className="section-eyebrow">The technique</div>
                <h3 className="emi-sub-h">Where soil EC and canopy NDVI <em>agree</em>, you've found a real zone.</h3>
                <p className="emi-sub-p">EC reveals what the <strong>soil</strong> can do — texture, water-holding, drainage. NDVI reveals what the <strong>canopy</strong> actually did. Stack them and the pattern that shows up in both layers is your management zone. The pattern that shows up in only one is your sampling priority.</p>
              </div>

              <figure className="emi-compare">
                <div className="emi-compare-frame">
                  <div className="emi-compare-tag">
                    <span className="emi-compare-code">NDVI</span>
                    <span className="emi-compare-name">Canopy vigour</span>
                  </div>
                  <div
                    className="emi-compare-img"
                    role="img"
                    aria-label="NDVI satellite imagery of the block — canopy vigour"
                    data-img-file="assets/portal-vigour-mapping.png"
                    style={{ backgroundImage: "url('assets/portal-vigour-mapping.png')" }} />
                  <div className="emi-compare-foot">
                    <span>2024-11-15 → 2025-02-03</span>
                    <span>0.59 → 0.74 index</span>
                  </div>
                </div>

                <div className="emi-compare-vs" aria-hidden="true">
                  <span className="emi-compare-vs-line" />
                  <span className="emi-compare-vs-chip">VS</span>
                  <span className="emi-compare-vs-line" />
                </div>

                <div className="emi-compare-frame emi-compare-frame-ec">
                  <div className="emi-compare-tag">
                    <span className="emi-compare-code">EC 50</span>
                    <span className="emi-compare-name">Soil conductivity · 50 cm</span>
                  </div>
                  <div
                    className="emi-compare-img"
                    role="img"
                    aria-label="EMI soil EC at 50 cm depth"
                    data-img-file="assets/emi-depth-50cm.png"
                    style={{ backgroundImage: "url('assets/emi-depth-50cm.png')" }} />
                  <div className="emi-compare-foot">
                    <span>5 × 5 m resolution</span>
                    <span>3.04 → 9.73 mS/m</span>
                  </div>
                </div>
              </figure>

              <div className="emi-readouts">
                <div className="emi-readout">
                  <span className="emi-readout-code">A</span>
                  <strong>Low NDVI + low EC</strong>
                  <p>Sand or shallow soils — chronically low vigour. Drainage and rooting volume, not fertiliser, are the limits here.</p>
                </div>
                <div className="emi-readout">
                  <span className="emi-readout-code">B</span>
                  <strong>High NDVI + mid EC</strong>
                  <p>The block's good soil. Match inputs to expected yield; this is the baseline every other zone is judged against.</p>
                </div>
                <div className="emi-readout">
                  <span className="emi-readout-code">C</span>
                  <strong>EC and NDVI disagree</strong>
                  <p>The soil says one thing, the canopy says another. Sample first — irrigation, salinity, or a buried chemistry issue is hiding here.</p>
                </div>
              </div>
            </div>

            {/* ============== EMI · combo examples → lead to zonal management ============== */}
            <div className="emi-sub" id="emi-examples">
              <div className="emi-sub-head">
                <div className="section-eyebrow">Examples from working orchards</div>
                <h3 className="emi-sub-h">Put two layers side by side. <em>The block stops looking uniform.</em></h3>
                <p className="emi-sub-p">Each block below is scanned with EMI and seen by the satellite. Read the soil against what the canopy and the crop actually did, and the same truth shows up every time — the field is not one thing, and managing it as if it were leaves yield and money on the table.
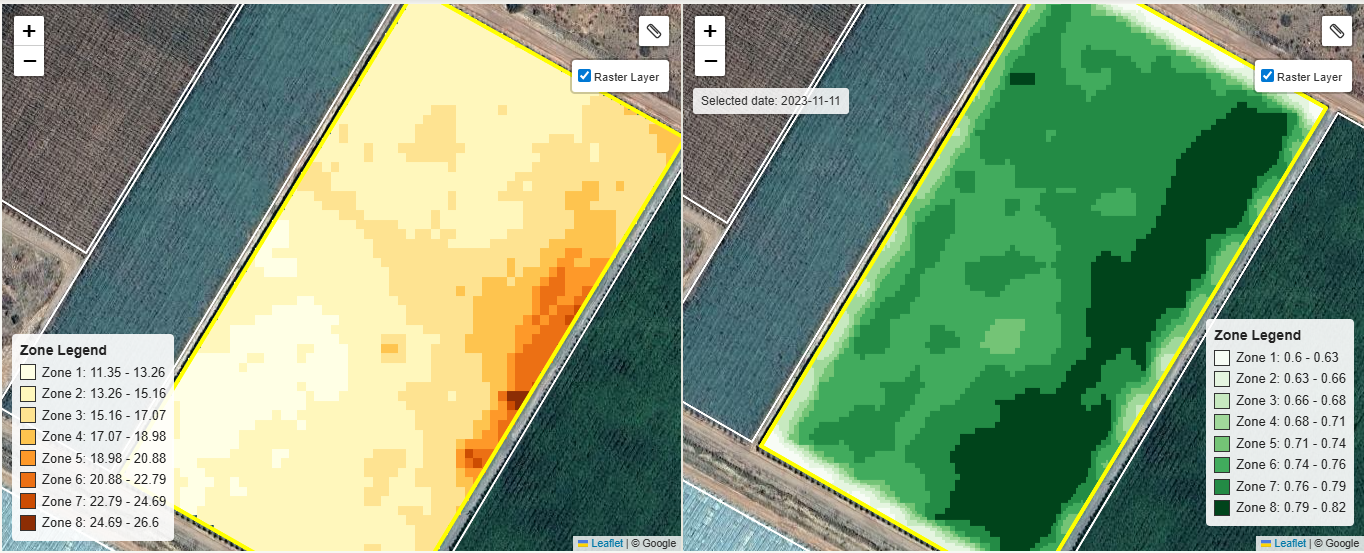
</p>
              </div>

              <div className="emi-combo-list">

                <figure className="emi-combo emi-combo-story">
                  <header className="emi-combo-head">
                    <span className="emi-combo-code">01</span>
                    <span>
                      <strong className="emi-combo-title">High EC drives strong vigour — and <em>weak fruit set</em></strong>
                      <span className="emi-combo-sub">One block · the soil layer, read twice</span>
                    </span>
                  </header>

                  <div className="emi-story">
                    <div className="emi-story-beat">
                      <div className="emi-story-beathead">
                        <span className="emi-story-step">01</span>
                        <h4 className="emi-story-claim">Where the soil EC runs highest, the canopy grows <em>strongest</em>.</h4>
                      </div>
                      <img className="emi-story-img" src="assets/emi-ec-vs-ndvi.png" alt="EC soil conductivity map beside canopy NDVI map for the block — the high-EC core carries the strongest canopy" data-img-file="assets/emi-ec-vs-ndvi.png" loading="lazy" />
                      <p className="emi-story-cap"><strong>EC, left</strong> · 11.35–26.6 mS/m &nbsp;·&nbsp; <strong>NDVI, right</strong> · 0.6–0.82. The high-EC core holds more water and more nutrients — and the canopy answers with the darkest green on the block.
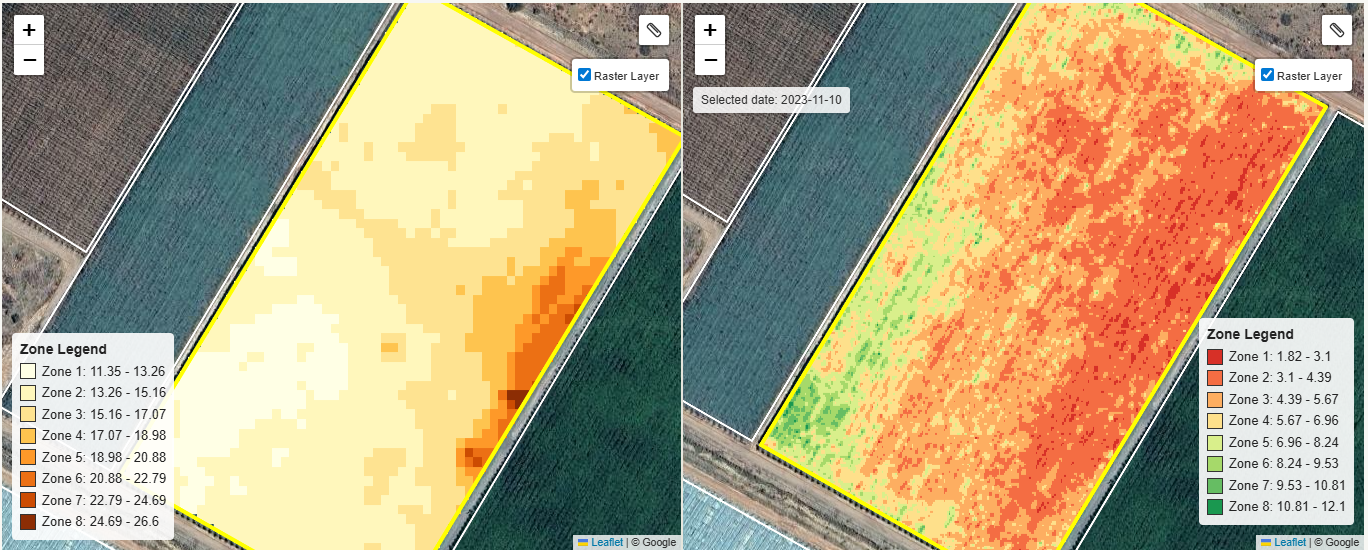
</p>
                    </div>

                    <div className="emi-story-link" aria-hidden="true"><span>but</span></div>

                    <div className="emi-story-beat">
                      <div className="emi-story-beathead">
                        <span className="emi-story-step">02</span>
                        <h4 className="emi-story-claim">…and the very same core gives up its <em>fruit</em>.</h4>
                      </div>
                      <img className="emi-story-img" src="assets/emi-ec-vs-yield.png" alt="EC soil conductivity map beside the measured yield map for the same block — the same high-EC core runs low on yield" data-img-file="assets/emi-ec-vs-yield.png" loading="lazy" />
                      <p className="emi-story-cap"><strong>EC, left</strong> · 11.35–26.6 mS/m &nbsp;·&nbsp; <strong>Yield, right</strong> · 1.82–12.1 · 2023-11-10. The core runs red — that vigour went into wood and leaf and fruit set fell away. The lighter, low-EC edges grew less but set and carried more fruit.</p>
                    </div>

                    <p className="emi-story-punch">One block. <em>Two opposite needs.</em> No single blanket rate can satisfy both.
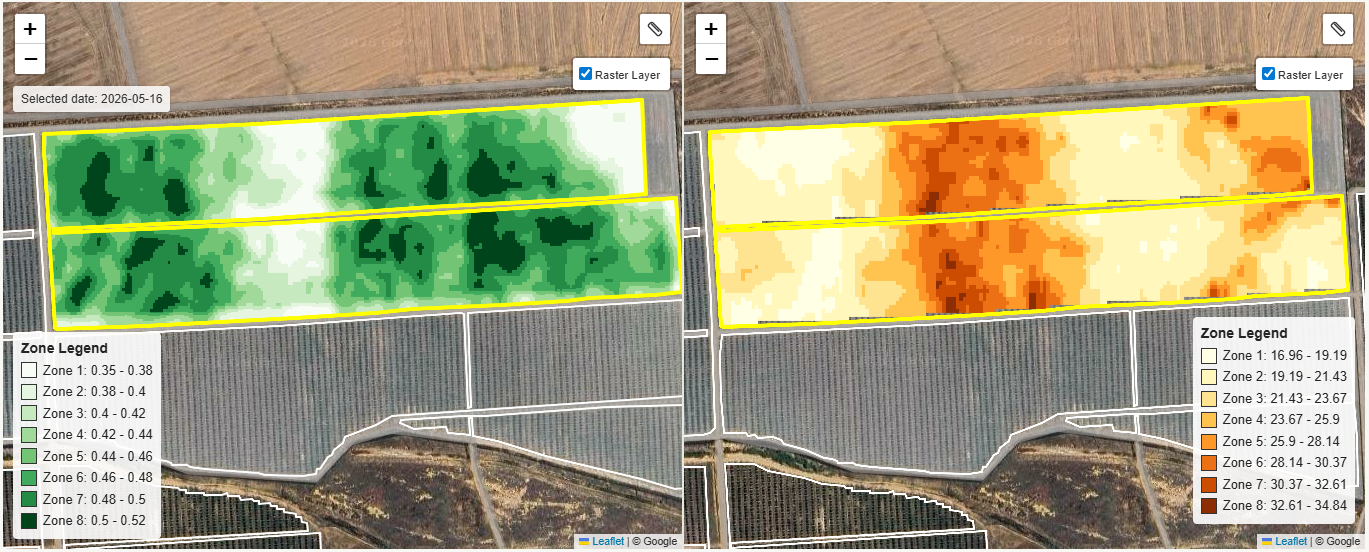
</p>
                  </div>
                </figure>

                <figure className="emi-combo emi-combo-story">
                  <header className="emi-combo-head">
                    <span className="emi-combo-code">02</span>
                    <span>
                      <strong className="emi-combo-title">A different block — read the sub-soil and you can <em>see the drainage</em></strong>
                      <span className="emi-combo-sub">Canopy NDVI · vs · deep EC</span>
                    </span>
                  </header>

                  <div className="emi-story">
                    <div className="emi-story-beat">
                      <div className="emi-story-beathead">
                        <span className="emi-story-step">↳</span>
                        <h4 className="emi-story-claim">The strongest canopy sits over the <em>better-draining</em> sub-soil.</h4>
                      </div>
                      <img className="emi-story-img" src="assets/emi-ndvi-vs-ec-drainage.png" alt="Canopy NDVI map beside deep EC map across two strip blocks" data-img-file="assets/emi-ndvi-vs-ec-drainage.png" loading="lazy" />
                      <p className="emi-story-cap"><strong>NDVI, left</strong> · 0.35–0.52 &nbsp;·&nbsp; <strong>EC, right</strong> · 16.96–34.84 mS/m. Where the deep EC reads high, water and nutrients are held where the roots can reach them — so the canopy is strongest right there. Read the conductive layer and the drain path is visible before you ever cut a trench.</p>
                    </div>
                  </div>
                </figure>

              </div>

              <p className="emi-combo-lead">Every one of these blocks asks for different inputs in different corners. That is the whole case for zonal management — so the only question left is <em>where do the samples go?</em></p>
            </div>

            {/* ============== EMI · From overlay to management zones ============== */}
            <div className="emi-sub emi-sub-zones" id="emi-zones">
              <div className="emi-zones-grid">
                <div className="emi-zones-text">
                  <div className="section-eyebrow">From overlay to zones</div>
                  <h3 className="emi-sub-h">Stop sampling on a grid. <em>Sample by zone.</em></h3>
                  <p className="emi-sub-p">Once EC and NDVI are stacked, the platform draws the management zones for you — groups of trees that behave the same way. Sample inside the zone, not on a grid that ignores it: a grid point can land right on the border between two soils and represent neither, while several sub-samples composited inside a zone describe its chemistry honestly. The payoff comes at the spreader — it applies the right amount right up to the edge of the soil boundary, instead of feathering an interpolated 50×50&nbsp;m average across a line it can't see.</p>
                  <ul className="emi-zones-list">
                    <li><span className="emi-zones-num">5×5 m</span> EC pixels reconciled with 10 m NDVI</li>
                    <li><span className="emi-zones-num">3–7</span> zones per block, automatically delineated</li>
                    <li><span className="emi-zones-num">6–12</span> targeted samples instead of a 50×50 m grid</li>
                    <li><span className="emi-zones-num">1</span> prescription file per zone, per product</li>
                  </ul>
                </div>
                <figure className="emi-zones-figure">
                  <div
                    className="emi-zones-img"
                    role="img"
                    aria-label="EMI + NDVI overlay with management zones and soil sample pins"
                    data-img-file="assets/emi-management-zones.png"
                    style={{ backgroundImage: "url('assets/emi-management-zones.png')" }} />
                  <figcaption>
                    <span className="emi-zones-fig-label">EC + NDVI overlay</span>
                    <span>Sample pins placed by zone, not grid · 8 farms, 301 ha</span>
                  </figcaption>
                </figure>
              </div>
            </div>

            {/* ============== EMI · Zoning technique (real case study walkthrough) ============== */}
            <div className="emi-sub" id="emi-technique">
              <div className="emi-sub-head">
                <div className="section-eyebrow">Soil EC + NDVI zoning — the technique</div>
                <h3 className="emi-sub-h">Four layers in. <em>One sampling plan out.</em></h3>
                <p className="emi-sub-p">This is the exact procedure used in the <a href="#" onClick={(e) => {e.preventDefault();setRoute('case-study');}} style={{ color: 'var(--accent)' }}>case study</a> — stacking the raw EC raster against two NDVI snapshots, letting the agreement between them draw the zones, then placing one composite sample per zone. Same recipe, scaled across the whole operation.</p>
              </div>

              <div className="emi-tech-steps">

                <article className="emi-tech-step">
                  <header className="emi-tech-step-head">
                    <span className="emi-tech-num">01</span>
                    <h4 className="emi-tech-step-title">Raw EC layer</h4>
                  </header>
                  <div
                    className="emi-tech-img"
                    role="img"
                    aria-label="Raw EMI soil EC raster — orange palette, cream to dark brown"
                    data-img-file="assets/zoning-ec-raw.png"
                    style={{ backgroundImage: "url('assets/zoning-ec-raw.png')" }}>
                    <span className="emi-tech-tag">EC · 25/50/90 cm</span>
                  </div>
                  <p className="emi-tech-step-cap">The <strong>soil truth</strong>. Conductivity at 5 × 5 m resolution shows where the texture, water-holding and salinity actually sit — independent of what's planted on top.</p>
                </article>

                <article className="emi-tech-step">
                  <header className="emi-tech-step-head">
                    <span className="emi-tech-num">02</span>
                    <h4 className="emi-tech-step-title">Two NDVI snapshots</h4>
                  </header>
                  <div className="emi-tech-stack">
                    <div
                      className="emi-tech-img"
                      role="img"
                      aria-label="NDVI snapshot A — earlier season with light/white low-vigour patches"
                      data-img-file="assets/zoning-ndvi-a.png"
                      style={{ backgroundImage: "url('assets/zoning-ndvi-a.png')" }}>
                      <span className="emi-tech-tag">NDVI · period A</span>
                    </div>
                    <div
                      className="emi-tech-img"
                      role="img"
                      aria-label="NDVI snapshot B — peak canopy, mostly uniform green"
                      data-img-file="assets/zoning-ndvi-b.png"
                      style={{ backgroundImage: "url('assets/zoning-ndvi-b.png')" }}>
                      <span className="emi-tech-tag">NDVI · period B</span>
                    </div>
                  </div>
                  <p className="emi-tech-step-cap">The <strong>canopy truth</strong>, at two different points in the season. Comparing snapshots filters out one-off events and exposes the patterns the trees show every year.</p>
                </article>

                <article className="emi-tech-step">
                  <header className="emi-tech-step-head">
                    <span className="emi-tech-num">03</span>
                    <h4 className="emi-tech-step-title">Zones <em>where they agree</em></h4>
                  </header>
                  <div
                    className="emi-tech-img"
                    role="img"
                    aria-label="EC raster with red management zone boundaries overlaid"
                    data-img-file="assets/zoning-zones-overlay.png"
                    style={{ backgroundImage: "url('assets/zoning-zones-overlay.png')" }}>
                    <span className="emi-tech-tag">Zones · red boundary</span>
                  </div>
                  <p className="emi-tech-step-cap">Where soil EC and canopy NDVI <strong>agree</strong>, you've found a real management zone. The algorithm draws them; the agronomist confirms them.</p>
                </article>

                <article className="emi-tech-step">
                  <header className="emi-tech-step-head">
                    <span className="emi-tech-num">04</span>
                    <h4 className="emi-tech-step-title">One composite sample <em>per zone</em></h4>
                  </header>
                  <div
                    className="emi-tech-img"
                    role="img"
                    aria-label="Sample positions inside each zone — colored dots grouped by zone, combined into one composite sample per zone"
                    data-img-file="assets/zoning-sample-points.png"
                    style={{ backgroundImage: "url('assets/zoning-sample-points.png')" }}>
                    <span className="emi-tech-tag">Sample points</span>
                  </div>
                  <p className="emi-tech-step-cap">Sub-samples within a zone are <strong>composited into one</strong> — capturing that zone's soil chemistry honestly, without the noise (or cost) of grid-based sampling.</p>
                </article>

              </div>

              <div className="emi-tech-multi">
                <div
                  className="emi-tech-multi-img"
                  role="img"
                  aria-label="Multi-farm aerial showing zone boundaries in red and color-coded sample points across many small blocks"
                  data-img-file="assets/zoning-multi-farm.png"
                  style={{ backgroundImage: "url('assets/zoning-multi-farm.png')" }} />
                <div className="emi-tech-multi-text">
                  <div className="section-eyebrow">Scales across the operation</div>
                  <h4>One recipe, <em>every block.</em></h4>
                  <p>The same four-step technique runs on a single 3-ha block or 300 ha of mixed cultivars and ages. Every block gets its own zones and its own sample plan — built from the data, not the grid.</p>
                  <div className="emi-tech-multi-stats">
                    <div><strong>301 ha</strong>8 farms · case study</div>
                    <div><strong>6–12</strong>samples per block · not 50×50 m</div>
                    <div><strong>1×</strong>composite · per zone</div>
                  </div>
                </div>
              </div>
            </div>

            {/* ============== EMI · ROI teaser — case study pull ============== */}
            <div className="emi-sub emi-sub-roi" id="emi-roi">
              <div className="emi-sub-head">
                <div className="section-eyebrow">What this unlocks</div>
                <h3 className="emi-sub-h">Zone-by-zone prescriptions. <em>R3,344/ha avoided. Every year.</em></h3>
                <p className="emi-sub-p">EMI + NDVI is the foundation. The product is the prescription that comes out the other end. Across eight farms and 301 hectares, the same technique you just saw avoided R5.0&nbsp;million in misallocated amendments — a 9.1× return on the scan and sampling spend.</p>
              </div>

              <div className="emi-roi-stats">
                <div className="emi-roi-stat">
                  <div className="emi-roi-num">9.1×</div>
                  <div className="emi-roi-lab">Return per R1 invested</div>
                  <div className="emi-roi-sub">EMI + zone sampling, 5 years</div>
                </div>
                <div className="emi-roi-stat">
                  <div className="emi-roi-num">R3,344</div>
                  <div className="emi-roi-lab">Avoided per hectare / year</div>
                  <div className="emi-roi-sub">vs. blanket application</div>
                </div>
                <div className="emi-roi-stat">
                  <div className="emi-roi-num">66%</div>
                  <div className="emi-roi-lab">Blanket spend wasted</div>
                  <div className="emi-roi-sub">K₂SO₄ · MgO · Gypsum</div>
                </div>
              </div>

              <div className="emi-roi-block">
                <div className="emi-roi-block-meta">
                  <span className="emi-roi-block-tag">Example · Block 3 · 7 zones · 5.4 ha</span>
                  <h4>Seven zones, seven prescriptions.</h4>
                  <p>
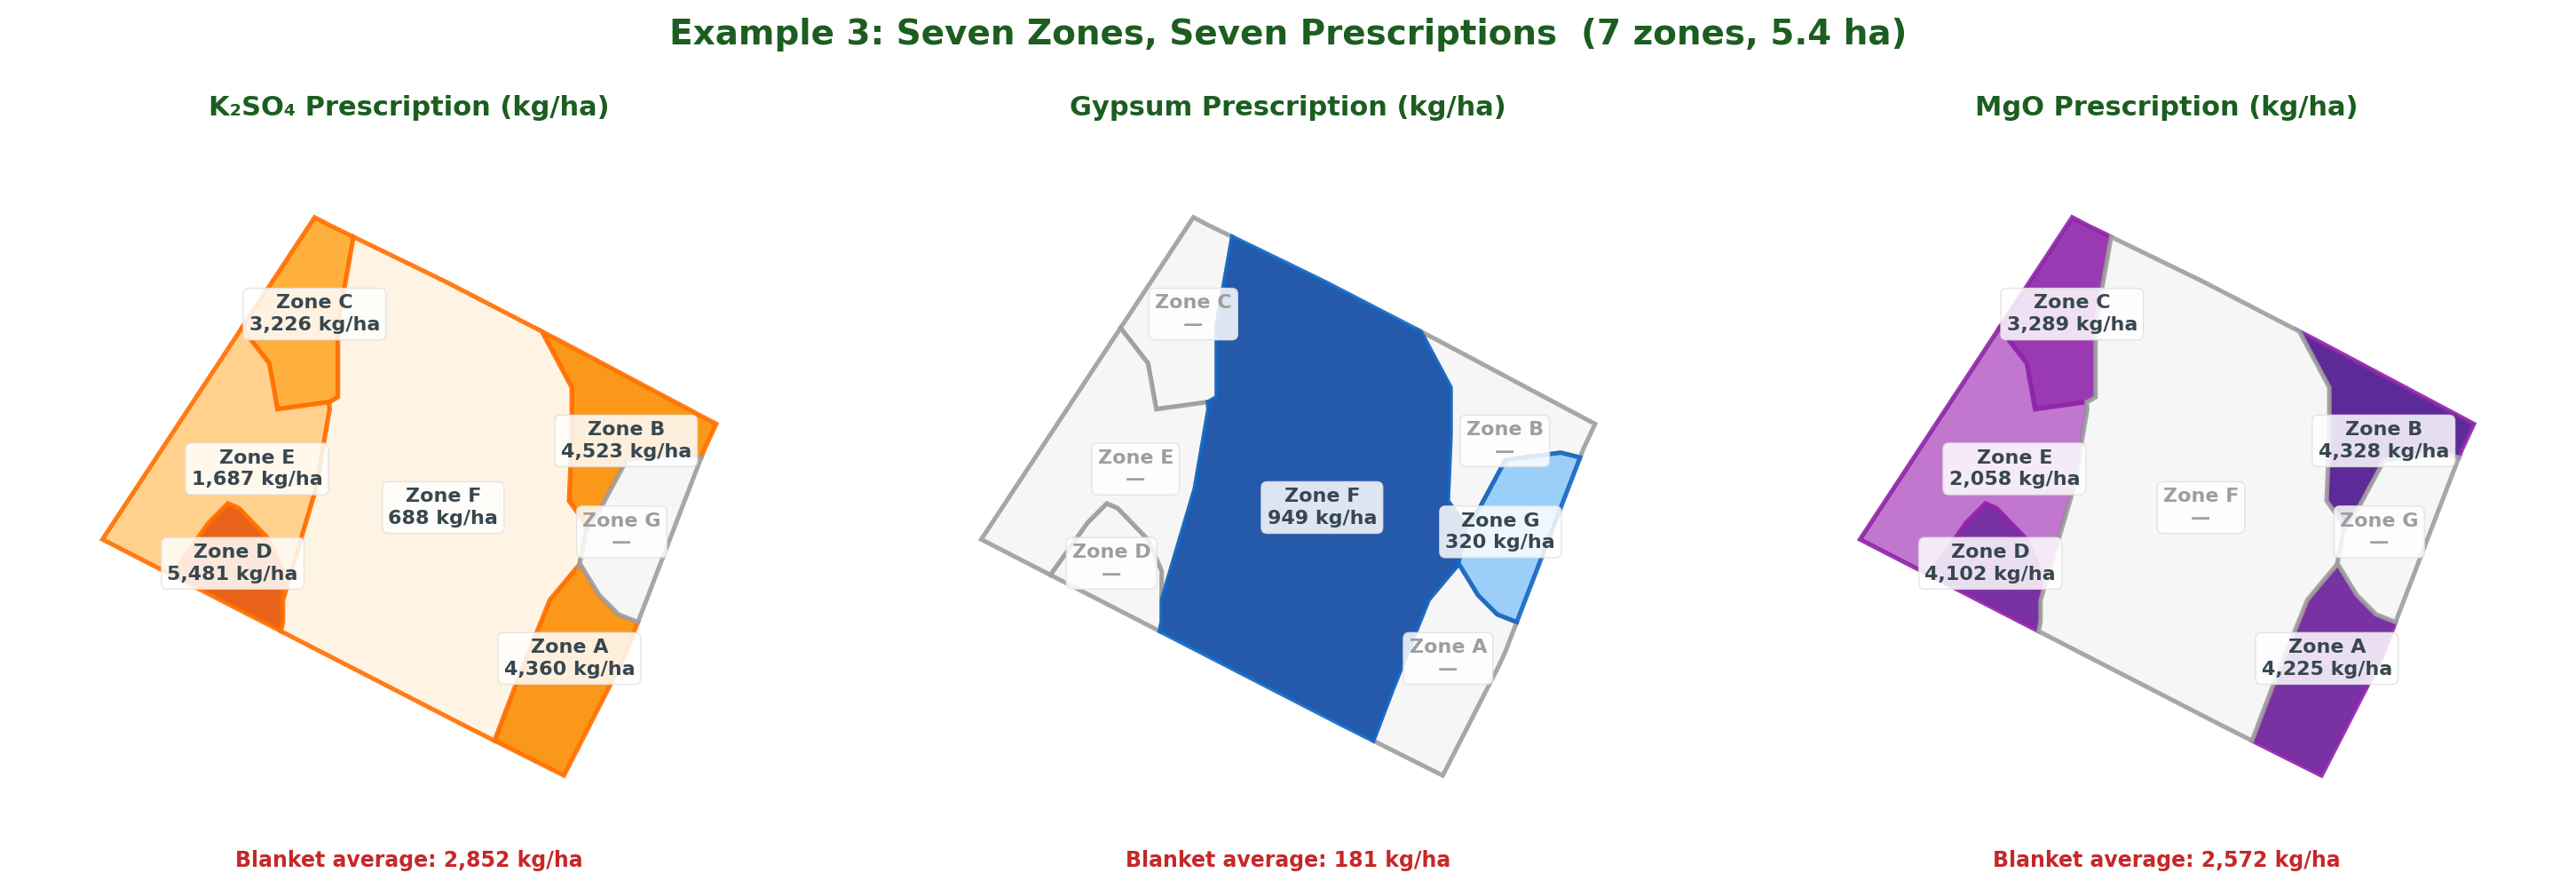
Zone D is severely K-deficient (1.1%) and needs 5,481 kg/ha K₂SO₄. Zone G already has adequate potassium (4.8%) and needs none — only 320 kg/ha gypsum to correct sodium. A blanket average would spread 2,852 kg/ha K₂SO₄ across all seven zones — under-dosing the deficient zones by up to 48% while Zone G receives nearly three tonnes of product per hectare it can't use.</p>
                  <div className="emi-roi-pull">One block, seven prescriptions. No composite sample can capture this.</div>
                  <a className="btn btn-primary" href="#" onClick={(e) => {e.preventDefault();setRoute('case-study');}}>Read the full case study →</a>
                </div>
                <figure className="emi-roi-block-fig">
                  <img src="assets/case-study/docx-fig03.png" alt="Block 3 prescription maps for K₂SO₄, gypsum, and MgO" />
                  <figcaption>K₂SO₄ · Gypsum · MgO — same block, three prescriptions.</figcaption>
                </figure>
              </div>

              <div className="emi-roi-mini-table">
                <table>
                  <thead>
                    <tr>
                      <th>Zone</th><th>Area</th><th>K%</th><th>Na%</th><th>K₂SO₄</th><th>Gypsum</th><th>MgO</th><th>Status</th>
                    </tr>
                  </thead>
                  <tbody>
                    <tr><td className="z">D</td><td>0.23</td><td>1.1</td><td>0.7</td><td>5,481</td><td>0</td><td>4,102</td><td>K deficient · Mg deficient</td></tr>
                    <tr><td className="z">F</td><td>2.88</td><td>3.2</td><td>1.9</td><td>688</td><td>949</td><td>0</td><td>K deficient · Na/Ca correction</td></tr>
                    <tr><td className="z">G</td><td>0.33</td><td>4.8</td><td>1.7</td><td>0</td><td>320</td><td>0</td><td>Na/Ca correction</td></tr>
                  </tbody>
                </table>
                <div className="emi-roi-mini-foot">3 of 7 zones shown · all prescriptions in kg/ha</div>
              </div>
            </div>
          </div>
        </section>


        {/* CTA ============================================== */}
        <section className="cta-banner">
          <div className="container-wide" style={{ display: 'flex', justifyContent: 'space-between', alignItems: 'center', flexWrap: 'wrap', gap: 'var(--space-3)' }}>
            <div>
              <h2 style={{ marginBottom: 0 }}>Start with the <em style={{ fontFamily: "'Instrument Serif', serif", color: '#B8DC73' }}>soil.</em></h2>
              <p style={{ marginTop: 12 }}>Book an EMI scan, or read the full case study to see the ROI on eight farms.</p>
            </div>
            <div style={{ display: 'flex', gap: 10 }}>
              <a className="btn btn-primary btn-lg" href="#" onClick={(e) => {e.preventDefault();setRoute('contact');}}>Talk to us</a>
              <a className="btn btn-light btn-lg" href="#" onClick={(e) => {e.preventDefault();setRoute('case-study');}}>Read the case study</a>
            </div>
          </div>
        </section>
      </>);

  };
})();

Object.assign(window, { EMIPage: window.EMIPage });